Hi
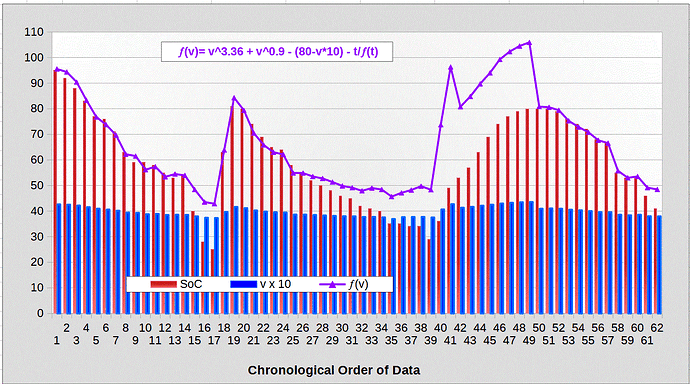
Below I have embedded a couple of graphs made from data I have collected over the last week.
Although the date is for an FP3 battery of 3060mAh is is likely to apply to other capacities.
It is also worth nothing this battery is 2 years and 5 months old.
I hope to get info from Fairphone one how the SoC is obtained, probably Columb Counting, but as I cannot implement that I am using a Circuit Voltage formula. (CV) not (OCV)
Using my formula:
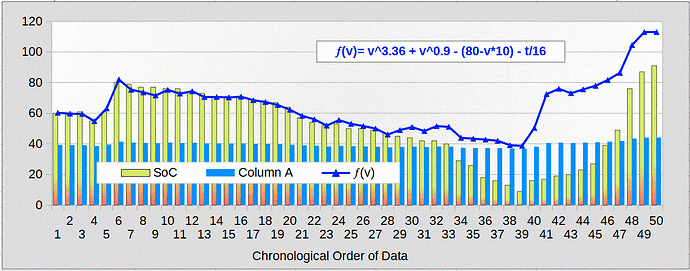
The fist graph shows the initial investigation and use the data supplied by the inbuilt Service tests which can be found by dialling *#*#66#*#* then select
Service tests > Test Single > Battery status check.
There are three bit of information that are used
- The state of charge (SoC) with shows the current capacity in percentage
- The current voltage
- The temperature
It is the relationship between the capacity and voltage that interest me whilst I incorporate the temp as a co-efficient as the temp modifies the batteries voltage and hence capacity.
So I will show the first graph and explain how I created it and significant observations
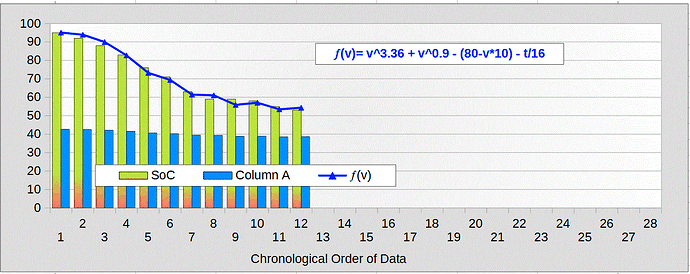
The second graph is just another example but where I had charged the battery to 95% from 9% to get a fuller range.
I’ll be updating this over the next hour and the second graph for a few days.
Whereas I think the graph is self explanatory, maybe that’s only as I developed it so.
-
The x axis is the chronological order but the time between records has no formula or measurable period, they are just times I chose to collect the data. Some are within a few minutes if I had just done a video call another period between data would be over night.
-
The green bars show the SoC which is on a decline as the battery gets used except for data points 4 to 6 where I charged form around 54% to 80% and later in the graph where I charged form 9% to 90%
-
The blue bars are the voltage times ten so it can be seen on the graph and so will range around 40
-
The blue line is a function of the voltage. It’s obvious from the raw data that the SoC and Voltage cannot be easily compared, but the voltage is the main indicator of how much the battery is charged. I have taken a small account of how the the battery has been resting but have not worked that well into the function.
Some Notes
-
Although not easily read from the graph, the voltage data equates to the nominal voltage on the battery of 3.85V when the battery is around 53% charged ~ Date point 25 when the voltage was 3.853
-
The voltage stayed above 3.7V down to an SoC of 16%
-
Once the SoC dropped to 50% there was an increasing dissociation via my formula between the SoC and the voltage, which I would expect.
This shows the battery is more stable and then probably more efficient between an SoC of 80% and 50%
To test out my formula I am doing a second record from 95% and noting the second graph using the same formula I am able to replicate the SoC as a function of voltage.
This was a backwards effort of creating formula where the SoC would be inline with the voltage, but as noted this only works above 50%
Possible Conclusions
With a voltage below 3.6 there is little capacity
With a voltage around 3.7 around 16%
With a voltage around 3.8 around 44%
With a voltage around 3.9 about 60%
With a voltage around 4.0 about 70%
With a voltage around 4.1 about 80%
With a voltage around 4.2 about 86%
If the BMS (battery management system is properly tuned to charging) there seems to a steady, and hopefully the most benign charging between 40% and 80%.
Given the small amount of data it may well be that the range is 20% to 80%
The taken is that below 20% is a strain on the battery and above 80% may lead to a time issue as the rate slows down to mitigate temperature increase.
Regarding the comment from Maximum charging voltage of FP3 batteries:
The voltage measured as referred to is the charging voltage noted by the in built Service test. However if the phone is taken off charge the reading does not alter to any significance and more than that if the battery is removed from the phone, the voltage on the end - and + pins are slightly higher.
So the 4.4v is not an inaccurate measure of the voltage being supplied and then it can be understood that the charging mechanism does not provide more than 4.4v and when the battery stabilises as a pre determined current, as yet unknown, the battery is deemed ‘full’ and the read-out says 100%.
100% output does not mean the battery is fully charged it means it is charged to the limit the manufactures design.
In the build of a 3000mAh battery the maximum could well be 3300mA or as low as 2700 and in either case it may be limited to 4.4V


